
The Data Centers Dynamic Model Gap
What TSOs Are Starting to Require and What Developers Are Unprepared to Provide

1. The Asymmetry That Cannot Persist
We require wind farms to submit detailed electromagnetic transient (EMT) models of every inverter and every controller. We require battery storage plants to demonstrate fault ride-through behaviour in simulation before connection. We require synchronous generators to provide governor and exciter models that match measured response within a defined tolerance band.
But a 500 MW data center — with more power electronics, more control interactions, and more behind-the-meter generation than most power plants — still connects to the transmission system with a static load model. Constant active power, constant power factor, no dynamics, no fault response, no representation of what actually happens behind the meter.
This article makes the case that this asymmetry is over. The events of the past three years have made it untenable for TSOs, the regulatory frameworks are catching up faster than most developers realise, and a new generation of dynamic model requirements is moving from stakeholder discussion to codified pre-energization gate in multiple jurisdictions simultaneously.
2. What Has Actually Happened on the System
The premise of this article is not theoretical. Major TSOs across three continents have now documented specific events in which the simultaneous disconnection of large electronic loads — data centers and cryptocurrency mining facilities — during normal grid faults has produced system-level reliability consequences that were neither anticipated nor modelled.
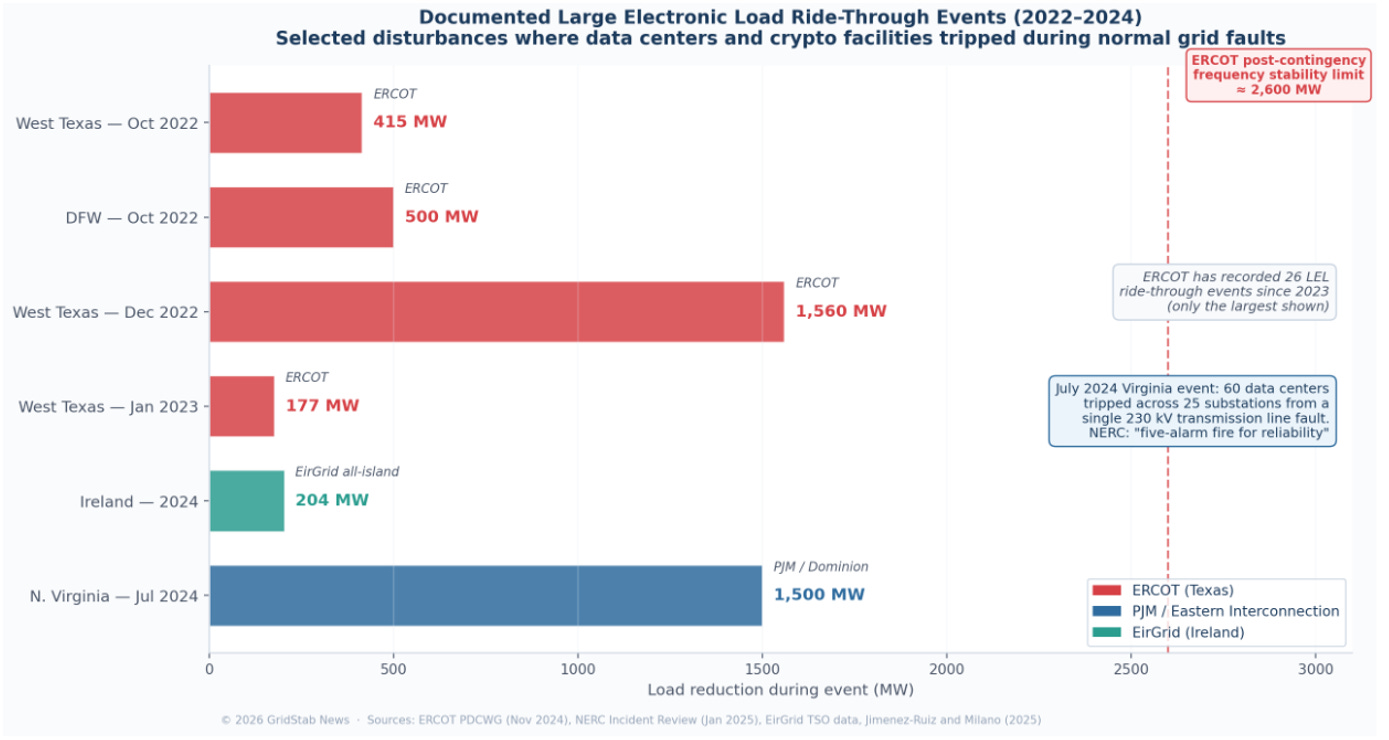
ERCOT: 26 documented LEL ride-through events since 2023. ERCOT presented its tally to the Board of Directors on December 8–9, 2025: 26 events since the beginning of 2023 in which large electronic loads tripped offline during normal grid disturbances. The single largest event documented in ERCOT records was a 1,560 MW load reduction in West Texas on December 7, 2022, following a single-line-to-ground fault at a 138 kV station that cleared in 3 cycles. The system absorbed it — but ERCOT’s own studies have established that the maximum amount of simultaneous load loss the system can sustain without exceeding the post-contingency frequency limit is approximately 2,600 MW. The trajectory is clear, and ERCOT has acted on it.
The July 2024 Virginia event. On the evening of July 10, 2024, a lightning arrestor failed on a 230 kV transmission line near Fairfax, Virginia. Auto-reclose logic produced six successive faults within 82 seconds, each between 42 and 66 milliseconds in duration. The protection system worked exactly as designed. But 60 data centers across 25 substations, all running internal UPS protection schemes that count voltage disturbances within a specified window, transferred their loads to backup power simultaneously. Approximately 1,500 MW of demand vanished from the grid in coordinated fashion. Frequency rose to 60.047 Hz and voltage rose to 1.07 per unit, requiring operators to remove shunt capacitor banks to bring voltage back within normal operating limits. NERC, the regulatory body responsible for the reliability of the North American bulk power system serving 400 million people, called it a near-miss — and established the Large Loads Task Force in August 2024 in direct response.
Ireland: the FRT problem made visible. On the all-island Irish transmission system, a single grid fault caused a documented 204 MW drop in data center demand, producing a rate of change of frequency of 0.12 Hz/s and a frequency zenith of 50.22 Hz — measurable system effects directly attributable to customer-side protection schemes. The Irish system is small, the data center penetration is concentrated, and the consequences become visible faster. EirGrid has been the first European TSO to codify the response, through its Grid Code modification proposal MPID345.
Cryptocurrency mining as the canary. NERC has separately documented 25 load loss events involving cryptocurrency mining facilities in ERCOT since November 2023, with individual event magnitudes ranging from 100 to 400 MW. The mechanisms are similar to data center protection schemes, and the cumulative reliability risk is being treated as part of the same regulatory response.
3. Why the Static Load Model Cannot Capture This
The events in Section 2 share a common thread: in every case, the load disconnection was customer-initiated, driven by internal UPS and protection logic that no static load model can represent. The TSO’s connection study assumed the data center would behave like 500 MW of industrial demand — a constant power load that draws what it draws regardless of grid voltage or frequency. The reality is that the data center behaves like an aggregation of tens of thousands of power-electronic devices, each making automated decisions in milliseconds based on voltage and frequency measurements at its own terminals. The aggregate response at the point of interconnection is not constant. It is sharp, coordinated, and large.
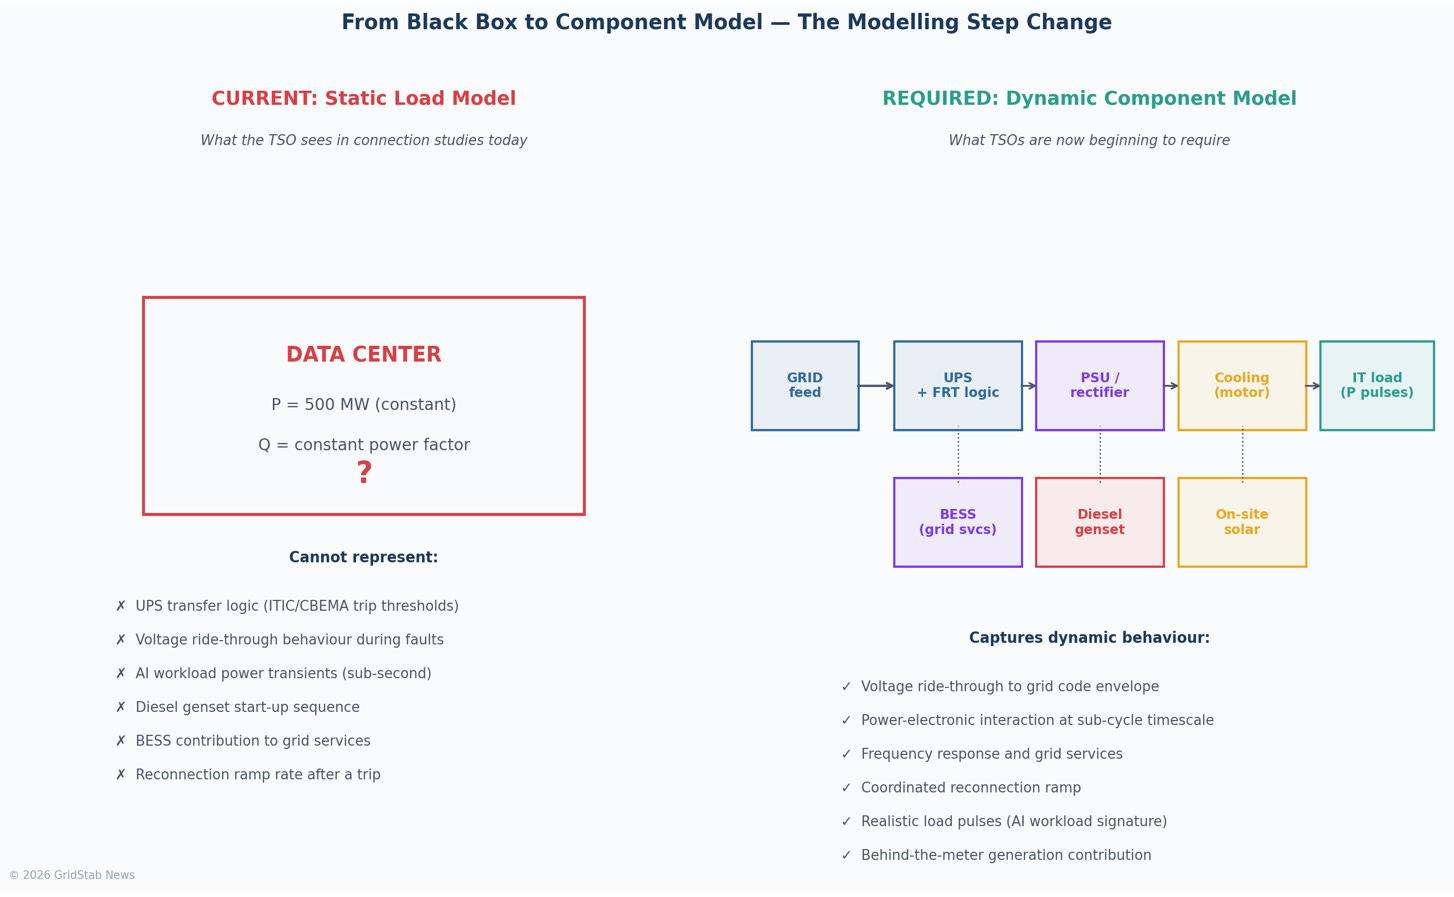
The components a static model omits. A static load model has no representation of the UPS transfer logic that determines when the facility disconnects from the grid. No representation of the ITIC/CBEMA tolerance curves that govern that transfer at the millisecond timescale. No representation of the fault ride-through envelope. No representation of the AI workload power transients that produce 30 ms ramps of 20–50% of rack nominal power — meaning ±30–60 kW per current Blackwell-class rack, and projected to reach ±150–300 kW per rack as 2027-era 600 kW Kyber racks are deployed. No representation of the diesel genset start-up sequence that, once engaged, can take five to ten minutes to ramp to full load. No representation of the BESS that might be providing fast frequency response or voltage support — or might be inert. And no representation of the reconnection ramp rate after a disconnection event, which determines whether the recovering facility imposes a second disturbance on the system as it returns.
Why this matters for transient stability analysis. A recent academic paper on dynamic models for data centers in the Irish transmission system put it bluntly: “A precise dynamic model of data centers adequate for transient stability analysis is not currently available.” The implication is that every contingency study a TSO has performed on a system with significant data center penetration has been based on a model that does not represent the actual dynamic behaviour of those loads. The connection studies have been correct in the steady state and increasingly inadequate in the dynamic regime that determines whether the system rides through a fault or cascades into a wider event.
To make this concrete, Figure 3 shows the response of four different load representations to a 50% voltage dip lasting 250 ms (left). The top row shows the disturbance imposed on the system; the bottom row shows the active power drawn from the grid at the data center connection point under each model.
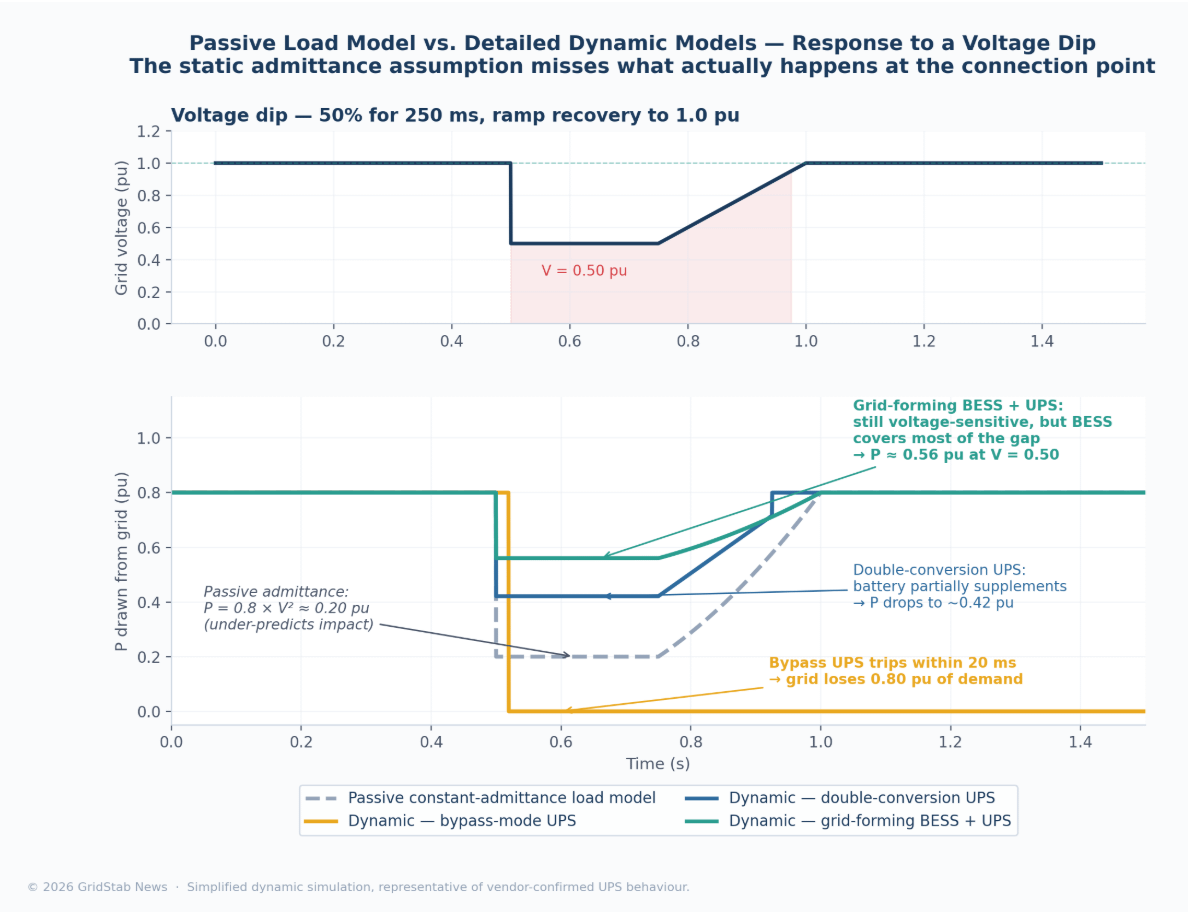
The passive admittance model predicts that load falls smoothly with the square of voltage — a gradual reduction from 0.80 pu to about 0.20 pu and back. This is what the majority TSO connection study currently assumes for a data center. The reality is fundamentally different. A bypass-mode UPS hits its ITIC threshold within 20 ms and transfers the entire load to battery, removing 0.80 pu of demand from the grid in a single step. A classic double-conversion UPS rides through the dip on its internal battery, partially supplementing the load (the grid sees a reduced but non-zero draw), and trips only if the dip exceeds 150 ms. A grid-forming BESS holds the load at 0.80 pu throughout, simultaneously injecting reactive power to support voltage recovery — the only model among the four that actively helps the grid.
The modelling implication. A TSO using the passive model will not accurately predict the response of the data centers to a voltage dip (it never sees the cliff-edge trip of bypass-mode UPSes). The system can therefore look more robust on paper than it is in reality — which is exactly the pattern the documented events of Section 2 have revealed.
You reached 1/3 of the paper, this is the end of the free preview
What follows behind the paywall:
Section 4: From Black Box to Component Model — what the model must contain (six elements) and which simulation tools are now the baseline (EPRI UDM, CMLD, PSS/E, PSCAD)
Section 5:Where Each TSO Stands — Figure 3 (regulatory maturity matrix) + the three tiers (codified leaders: ERCOT, EirGrid, AEMO; in-progress: PJM/NERC, NESO; early: RTE, Energinet)
Section 6: The Compliance Roadmap for Developers — model development timeline (6–12 months), the three hardest elements, reusable frameworks for multi-site developers
Section 7: Recommendations — five for TSOs, four for developers, three for investors
Section 8: Why This Matters Now — closing argument that ties back to the Monday post question
Upgrade your subscription to GridStab News to unlock the full article, all past articles and all future technical deep dives.
